Working with Azure Functions and Log Analytics
Critical Logging
It is critical to get your logging strategy defined and implemented, this can help in all aspects of the dev loop, from adding features to troubleshooting bugs in production.
I really wish I had told myself this again and again during my latest adventure, but what turned from a proof of concept, to pilot to production in just under three months, proved again that the perception of “just writing some code” is always slower than taking some time to plan for the future.
The last thing on my mind during our 2 day pilot was structured logging, let alone a strategy for managing serverless applications across different deployment stacks. As the project headed for production we realised that we had to implement proper logging before we could go live.
I’ll save the structured logging for another time, I want to focus on what I learned about Application Insights and how this saved me from a half implemented logging strategy.
Application Insights
Application Insights is an Application Performance Management product. It will monitor client side, server and background services. You can read about it all from the link above, I wanted to focus on using it to monitor Azure Functions as App Insights is the default monitoring solution for these now.
Again I don’t want to get off track too much, but we ended up with a number of Azure Function “Function Apps”. The unit of deployment for Azure Functions is the “Function App” so we decided we would have separate apps for each part of our microservices architecture. Why is this important/relative? We decided to have separate Application Insights resources for each Function App, we could deploy another stack in another region and have a separate monitoring instance, again there were decisions made here and it is important to the queries below, just check your own requirements and trade offs here before doing the same.
Kusto
App Insights has some great metrics and charts out the box, the Live Stream is a great example. But if you want to get into some custom metrics queries, then Kusto is the way to go, this is the query language used for Log Analytics which is the data store behind Application Insights, you can review the basics here
For our scenario we had a couple of Function Apps deployed, the first would take a blob upload and run it through Azure Media Services (AMS), the second would take the output from AMS and notify our application, some sample code is here.
So that is great we have a serverless encoding pipeline, but from Application Insights we have a big hole in our timeline, we cannot track AMS as a dependency, we just get a notification when the job is complete. So my problem was stitching these two functions together to find out how long it was taking from event trigger to application notified.
I’d only half implemented structured logging at this stage, so I had a correlation id so I could track multiple events across their lifetime, but hadn’t quite got this working with Application Insights Custom Metrics!
WARNING: this is a hack, but demonstrates the awesome power of Kusto and shows no matter what you were thinking when you “tried” a logging strategy you can still get some data.
Don’t be like Matt, fix your logging!!!
Function - toTimeSpan
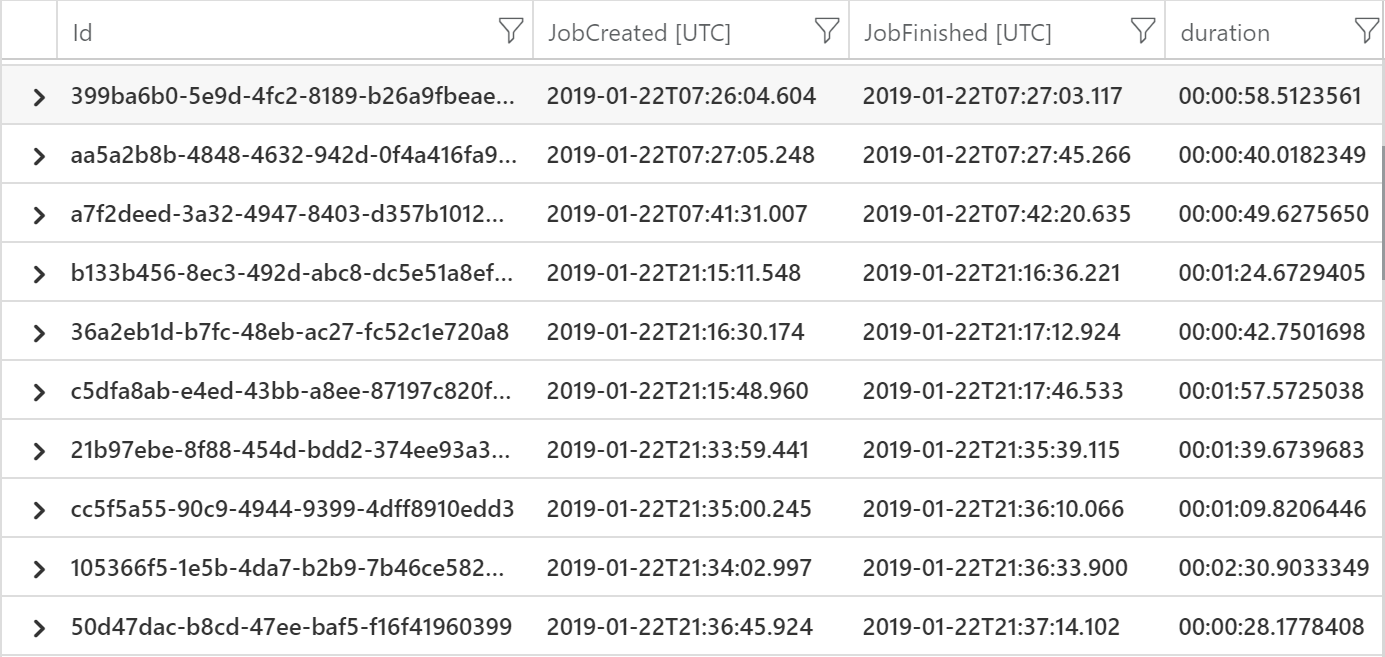
‘totimespan’ will give time between two dates, so we need to calculate when the first Functions fires to when the second Function notifies.
So in the below code we
- look for messages with specific text
- get the timestamp
- extract the correlation id which is appended to “output-“
- split the id from the rest of the text and make this a string
- repeat 1-4 on a join dataset from a different App Insights workspace called ‘notification’ - app(‘notification’).traces
- use ‘totimespan’ to give us elapsed time between two dates
(
    traces
    | where message contains "Status: Created new output"
    | project JobCreated=timestamp, getId=split(message, "Status: Created new output output-")[1]
    | project JobCreated, Id=split(getId, ",")[0]
    | extend Id = tostring(Id)
)
|
join
(
    app('notification').traces
    | where message contains "assetName = output-"
    | project JobFinished=timestamp, getId=split(message, "output-")[1]
    | project JobFinished, Id=split(getId, ",")[0]
    | extend Id = tostring(Id)
) on Id
| project Id, JobCreated, JobFinished
| extend duration=totimespan(JobFinished-JobCreated)
This gives us a view of the duration of the end to end process, taking into account the gap introduced by AMS.
mvexpand
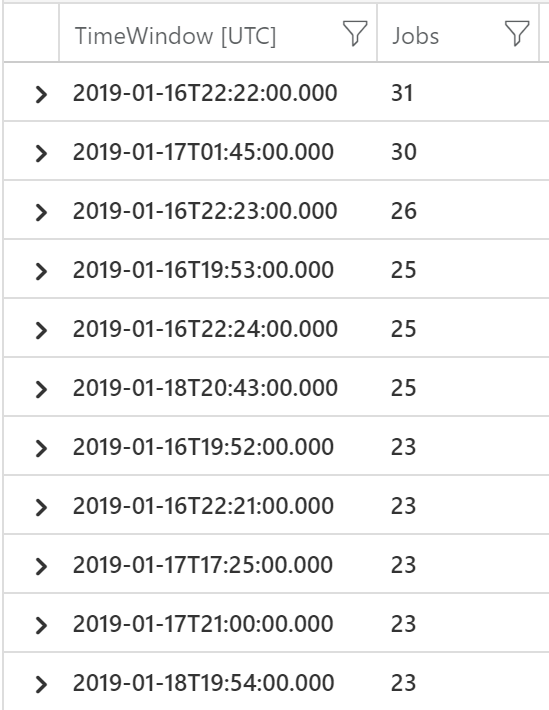
‘mvexpand’ - multi-value expand operation turns data in a collection into individual rows. We use this to expand the time window value from the range query of the job start and finish time, which is arranged into buckets for every minute. We summarize this by the count of jobs in each minute, to determine peak load.
So in the below code we
- look for messages with specific text
- get the timestamp
- extract the correlation id which is appended to “output-“
- split the id from the rest of the text and make this a string
- repeat 1-4 on a join dataset from a different App Insights workspace called ‘notification’ - app(‘notification’).traces
- use mvexpand and the range command to bucket each execution into 1m grains
- summarize
(
    traces
    | where message contains "Status: Created new output"
    | project JobCreated=timestamp, getId=split(message, "Status: Created new output output-")[1]
    | project JobCreated, Id=split(getId, ",")[0]
    | extend Id = tostring(Id)
)
|
join
(
    app('notification').traces
    | where message contains "assetName = output-"
    | project JobFinished=timestamp, getId=split(message, "output-")[1]
    | project JobFinished, Id=split(getId, ",")[0]
    | extend Id = tostring(Id)
) on Id
| mvexpand samples = range(bin(JobCreated, 1m), JobFinished , 1m)
| summarize Jobs=count(Id) by bin(todatetime(samples),1m)
| order by Jobs desc
This gives us a view of how many executions we had in a given ranged and was used to plan for peak application demand!


